skip to main |
skip to sidebar

Eli meant to behave but there were way too many options.


KoFi Button


Contributors
Eli Rabett
Eli Rabett, a not quite failed professorial techno-bunny who finally handed in the keys and retired from his wanna be research university. The students continue to be naive but great people and the administrators continue to vary day-to-day between homicidal and delusional without Eli's help. Eli notices from recent political developments that this behavior is not limited to administrators. His colleagues retain their curious inability to see the holes that they dig for themselves. Prof. Rabett is thankful that they, or at least some of them occasionally heeded his pointing out the implications of the various enthusiasms that rattle around the department and school. Ms. Rabett is thankful that Prof. Rabett occasionally heeds her pointing out that he is nuts.
Brian's Other Blog
On Line Textbooks
- Atmospheric Chemistry - Daniel Jacob
- Environmental Geosciences - Robert Stewart
- Ray Pierrehumbert on the physics of climate
- David Archer's Global Warming (Parts)
- Spencer Weart's Disovery of Global Warming
- Stratospheric Ozone
- Global Land Vegetation
- Polar Sea Ice
- Sea Surface Temperatures
- Skeptical Science - not a book but a resource
Mostly Science
- And Then There's Physics
- Blue Skies Research - J&J in the UK
- Bob Grumbine in the 21st Century
- Easterbrook's Serendipity
- Izen or Izen it not?
- James' Empty Blog
- Neven's Artic Sea Ice Blog
- Nick Stoke's Moyhu
- Real Climate
- Science of Doom
- Simon Donner's Maribo II
- Tamino's Open Mind
- The Weasel, aka Stoat
- Victor Venema
- Weather from Bridford, Devon, a beautiful corner of the world
Mostly Climate Policy
Other Lands
Southerners
Cuter in Bunny Ears
Blog Archive
-
▼
2013
(420)
-
▼
February
(39)
- China
- Obama immigration plan is too tough and too lenient
- Sadly No
- Wedgies
- Good idea! And if anybody doesn't like it, f*ck them!
- Rotten to the Core
- An Interesting Puzzler
- Markers
- The Letter Elsevier Should Have Sent Roger Jr.
- What's Wrong With Kansas
- I'm gonna take my paper and go home
- Contest for Planetary Solutions
- @EthonRaptor
- A request to readers - give us your Rubio climate ...
- More Heartland, Less Sense
- Dutch Cousins
- RTFR Pops
- Music From on High
- 2 C
- Consensus Palaeoclimate Sensitivity
- Solar Power, Electric Autos and Churnalism
- Galileo and Gleick
- Maybe Reid screwed the pooch on climate legislatio...
- Obama picks up the "it's not a coincidence" theme
- Return to Normal Science
- Dead Ball Game
- California dreaming of offsets
- Guides for the Perplexed
- Open for Comment
- The Cyanobacteria's Friend Publishes
- On Priors, Bayesians and Frequentists
- The Dagger
- Considerable Controversy
- MT and Willard Discuss JC
- Why the Poor Fail
- The OEM Version
- The Bitch Always Gets Her Money Back
- Scheduled For Release Friday, 5 PM
- Explain the Universe. Give Two Examples
-
▼
February
(39)
Nil Nisi
- A Few Things Illconsidered
- Arthur Smith
- Atmoz
- Capital Climate
- Chris Colose
- Climate Physics Forum
- Cruel Mistress
- Deep Climate
- Delayed Oscillator
- Deltoid
- Denis Delbecq
- Fergus Brown's Old Man
- Greenfyre
- Horatio's Muse
- John Nielsen-Gammon
- Lab Lemming
- Logical Science
- Magnus Westerstrand
- N3xus 6
- Policy Lass
- Post Normal Times
- Rick Piltze
- Some Are Boojums
- Throbgoblin
13 comments:
If geothermal is renewable, nuclear is too. Geothermal is nuclear, after all.
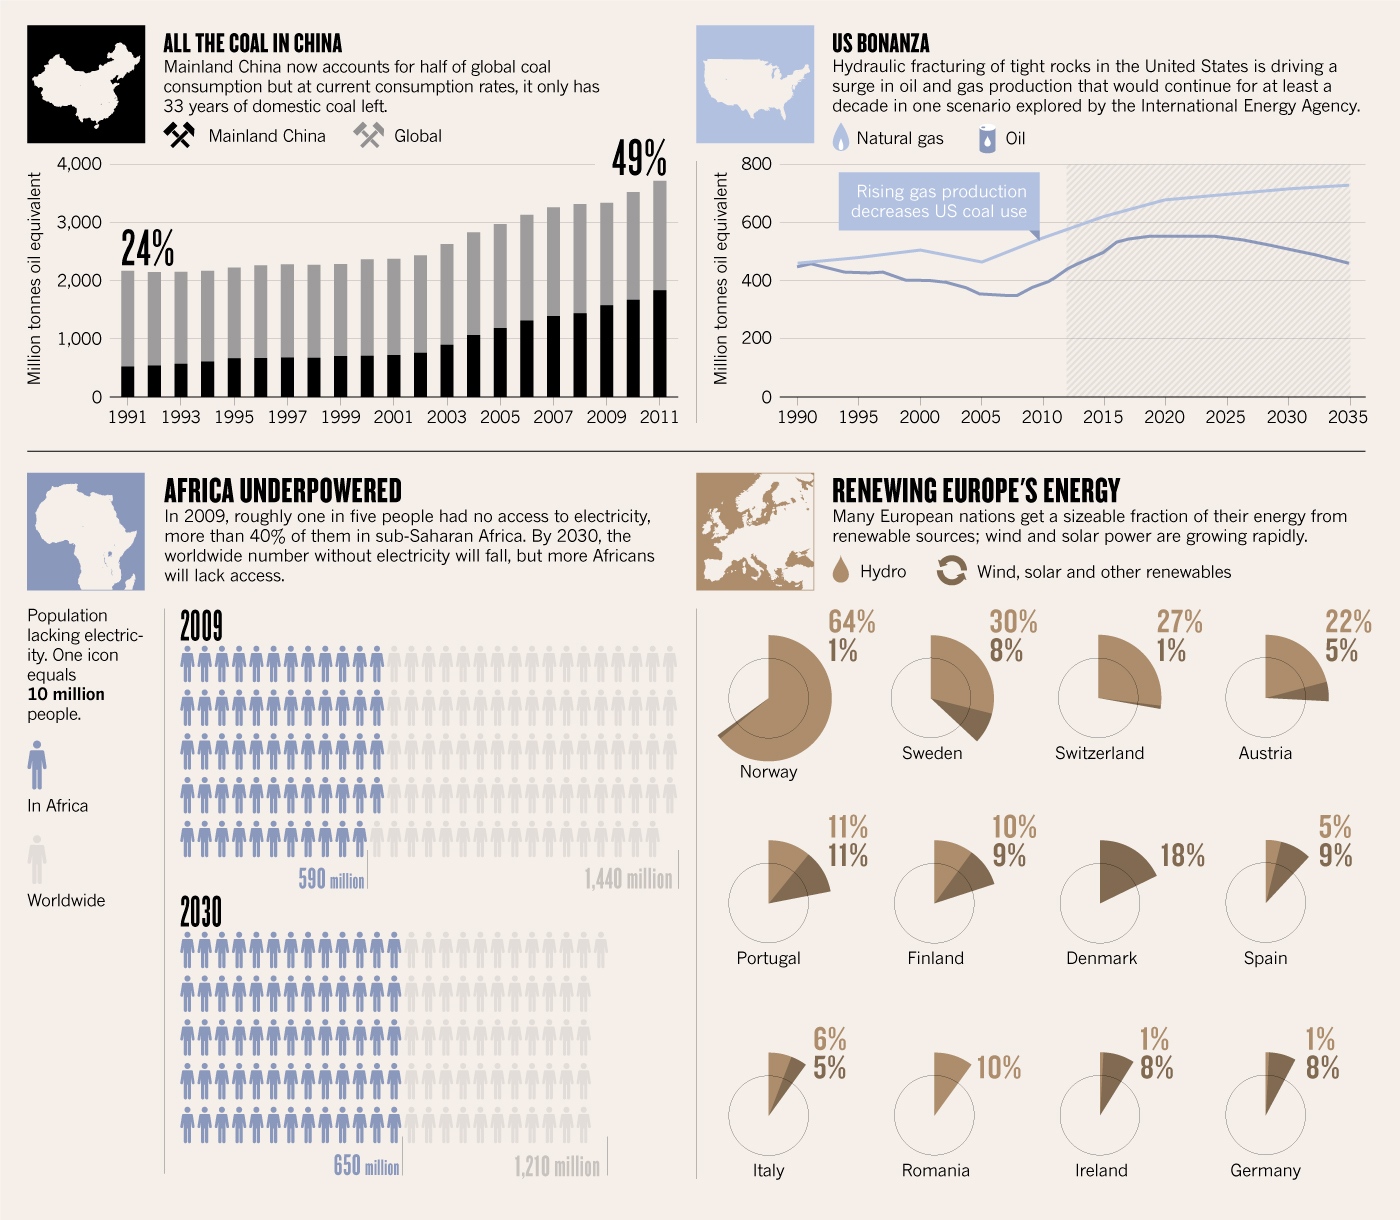
Where did Nature get the data from?
And this is energy used total, not just electricity use?
> Geothermal is nuclear, after all.
The jury's still a bit out on that one: condensation heat from the growing inner core may contribute.
BTW fossil fuels are renewable too, just very, very slowly
Not to be too picky, but the non-hydro bit should really be labelled "biomass/waste and other renewables"
At least the Finnish figures are plain wrong. The 2011 figures for total energy is as follows: Hydro and Wind 3%, Wood Fuels 22%, Peat 6% (As is probably known, opinions on peat's supposed renewability are strictly divided.)
The wind portion must be vanishingly small as only 1% of electricity is produced by wind. Solar does not even show on the official statistics.
What is growing is the share of ground sourced heat pumps, as well over 50% of new homes in Finland now have one, and this must have been included in the 3% share of "Others".
http://www.motiva.fi/taustatietoa/energiankaytto_suomessa/energian_kokonaiskulutus
-Another Anonymous Finn
The 2010 publication, Iel Energy Law in Finland, says, "hydro power generation currently accounts for approximately 20% of Finland's total electricity generation, corresponding to 13.2 TWh2 annually."
Curious.
J Bowers: it's simple - the total energy consumption of a country <> the electricity consumption of the same.
In terms of electricity the 2011 situation for Finland was as follows:
http://tilastokeskus.fi/til/salatuo/2011/salatuo_2011_2012-10-16_kuv_001_fi.html
from which we get:
Hydro: 17%
Wind 1%
Forest industry pulping and process wastes: 7%
Other wood-based fuels 7%
Other renewables: 1%
Peat 7%
-- Another (still anonymous) Finn.
@ Another Anonymous Finn: You said earlier that hydro and wind combined was 3%.
J Bowers, please be advised that there are two sets of energy statistics, and I think this fact applies equally to all countries.
One set consists of the ENTIRE energy consumption, including such rather major things such as liquid fuels for traffic and heat, and the like.
The other set consists of ELECTRICITY which means the fraction of all energy that is converted into electrical current for the private consumers and industry, and this usually equals both the losses and the real fraction billed by the utilities. Overall, this will naturally be smaller in quantity than the first set.
The national statistical agencies maintain BOTH sets of data, and furthermore, they are not directly comparable. For practical examples kindly see my posts above.
Thus, no discrepancy between the datasets I presented, but the Nature data here is wrong by a large margin in any case. I might see how much they have actually erred on the Swedish data.
- yours ever anonymous Finn
As shares of primary energy production, the situation in Denmark 2011:
Hydro: negligable
Wind: 3.9%
Biomass: 9.3%
http://www.ens.dk/en-US/Info/FactsAndFigures/Energy_statistics_and_indicators/Annual%20Statistics/Documents/Energy%20Statistics%202011.pdf
"Sveriges totala energitillförsel
Fördelad på energislag*, 2010, TWh"
'Total energy supply in Sweden breakdown by energy type, 2010, TWh.'
Biofuels, including peat 17%
Hydro power 8%
Heat Pumps in district heating 0.6%
Wind power 0.4%
http://www.ekonomifakta.se/sv/Fakta/Energi/Energibalans-i-Sverige/Energitillforsel/
-- The 1 & same anonymous Finn.
For completeness, I addded the electricity breakdown for Sweden, 2011:
Hydro 45%
Wind 4.1%
Combined heat & power (CHP) production, in district heating: 7%
CHP, in industry 4.0%
http://www.ekonomifakta.se/sv/Fakta/Energi/Energibalans-i-Sverige/Elproduktion/
CHP energy source is not specified, but in practice these would come predominantly from renewable sources, just as in Finland. Statistics on this is found separately at http://www.svenskenergi.se/upload/Statistik/El%C3%A5ret/ENG_Sv%20Energi_el%C3%A5ret2011.pdf diagram #26
The same source also contains a Nordic production mix diagram.
-F
Post a Comment